Online Monitoring of Buderus Logamatic 4000 Series Controllers
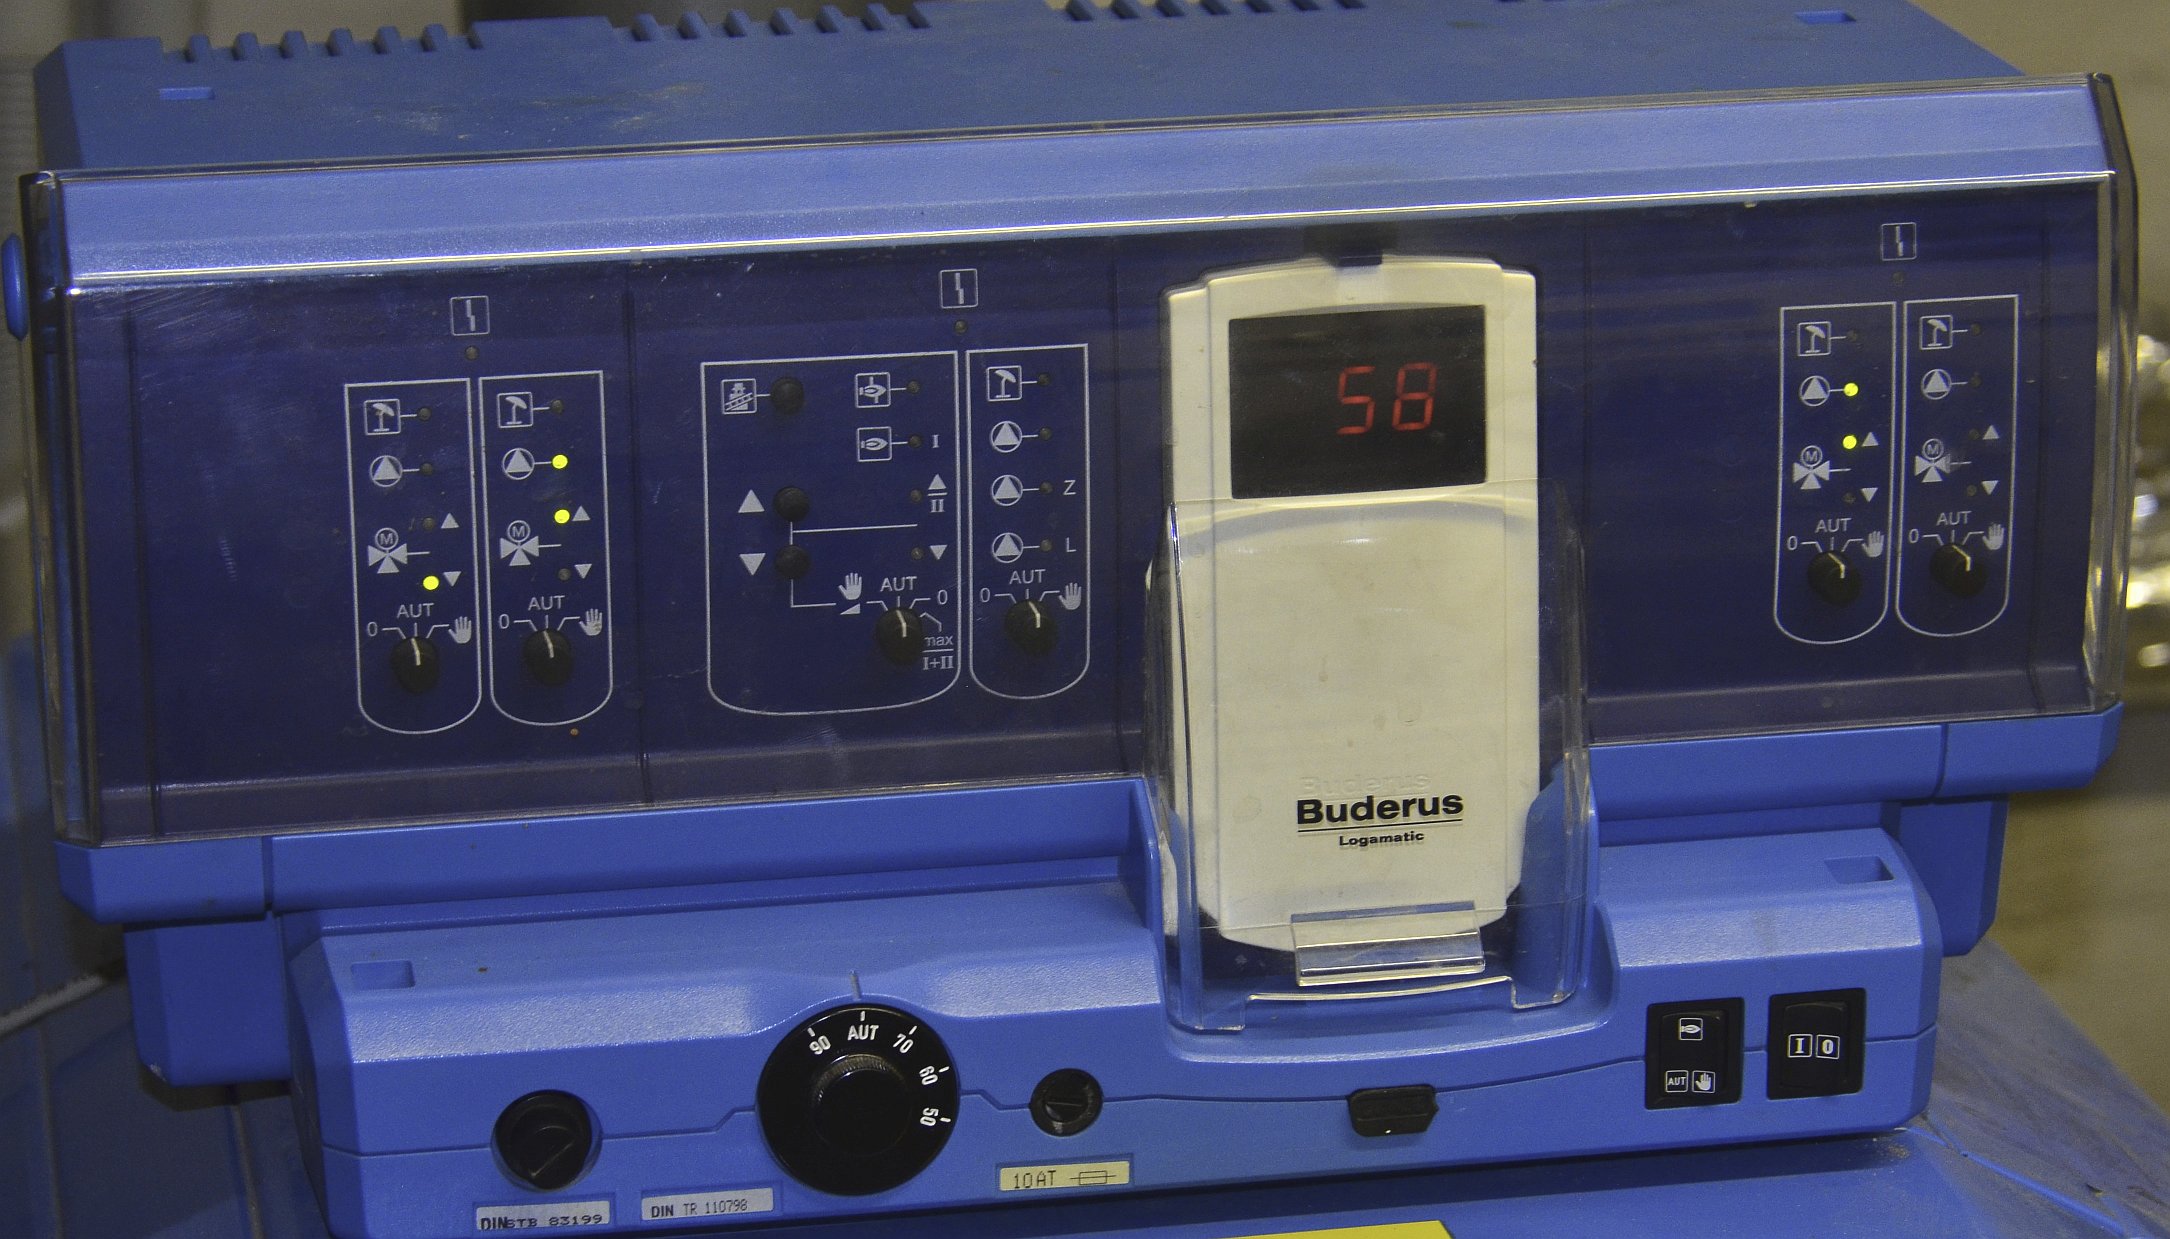
Buderus Series Logamatic 4000 Controller
For quite some time I had wanted to monitor the heating system in my house via the Internet. The gas furnace is controlled by a Buderus Logamatic Series 4000 controller. Of the four (+1) zones, I am using three — first floor, ground floor and floor heating in bathrooms.
This controller dates from the early 2000s but even then it was not quite up to the times.
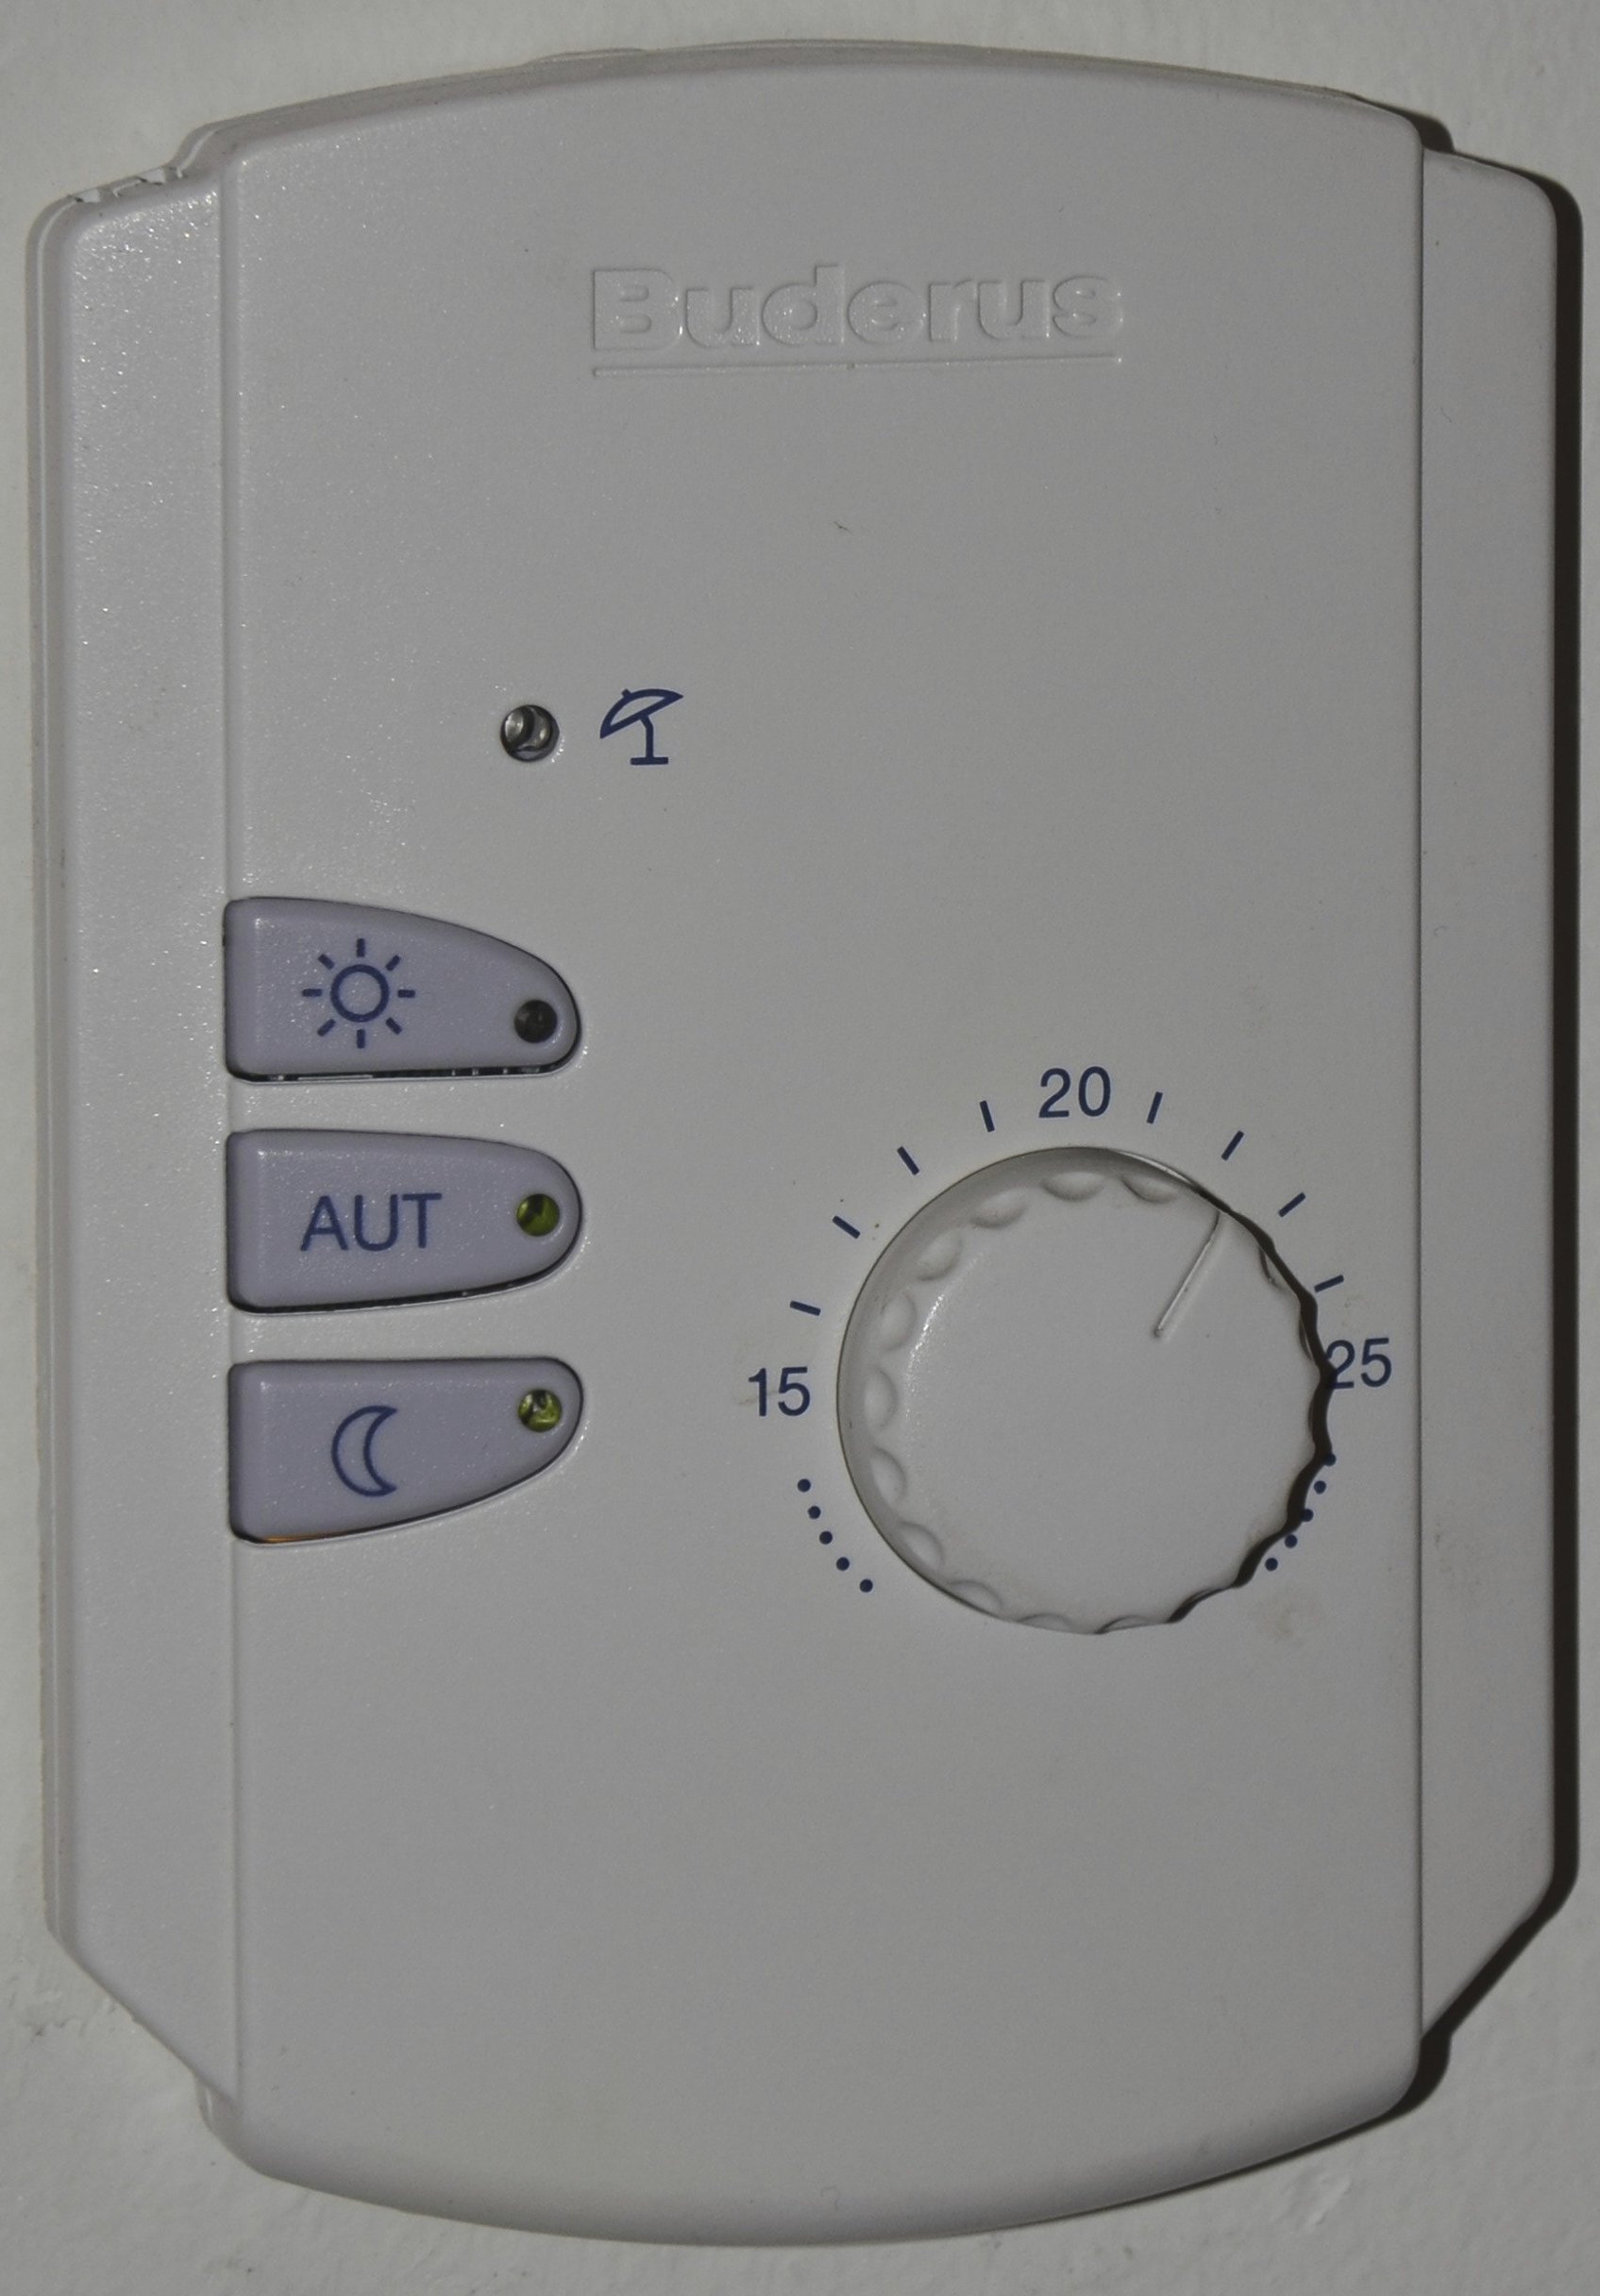
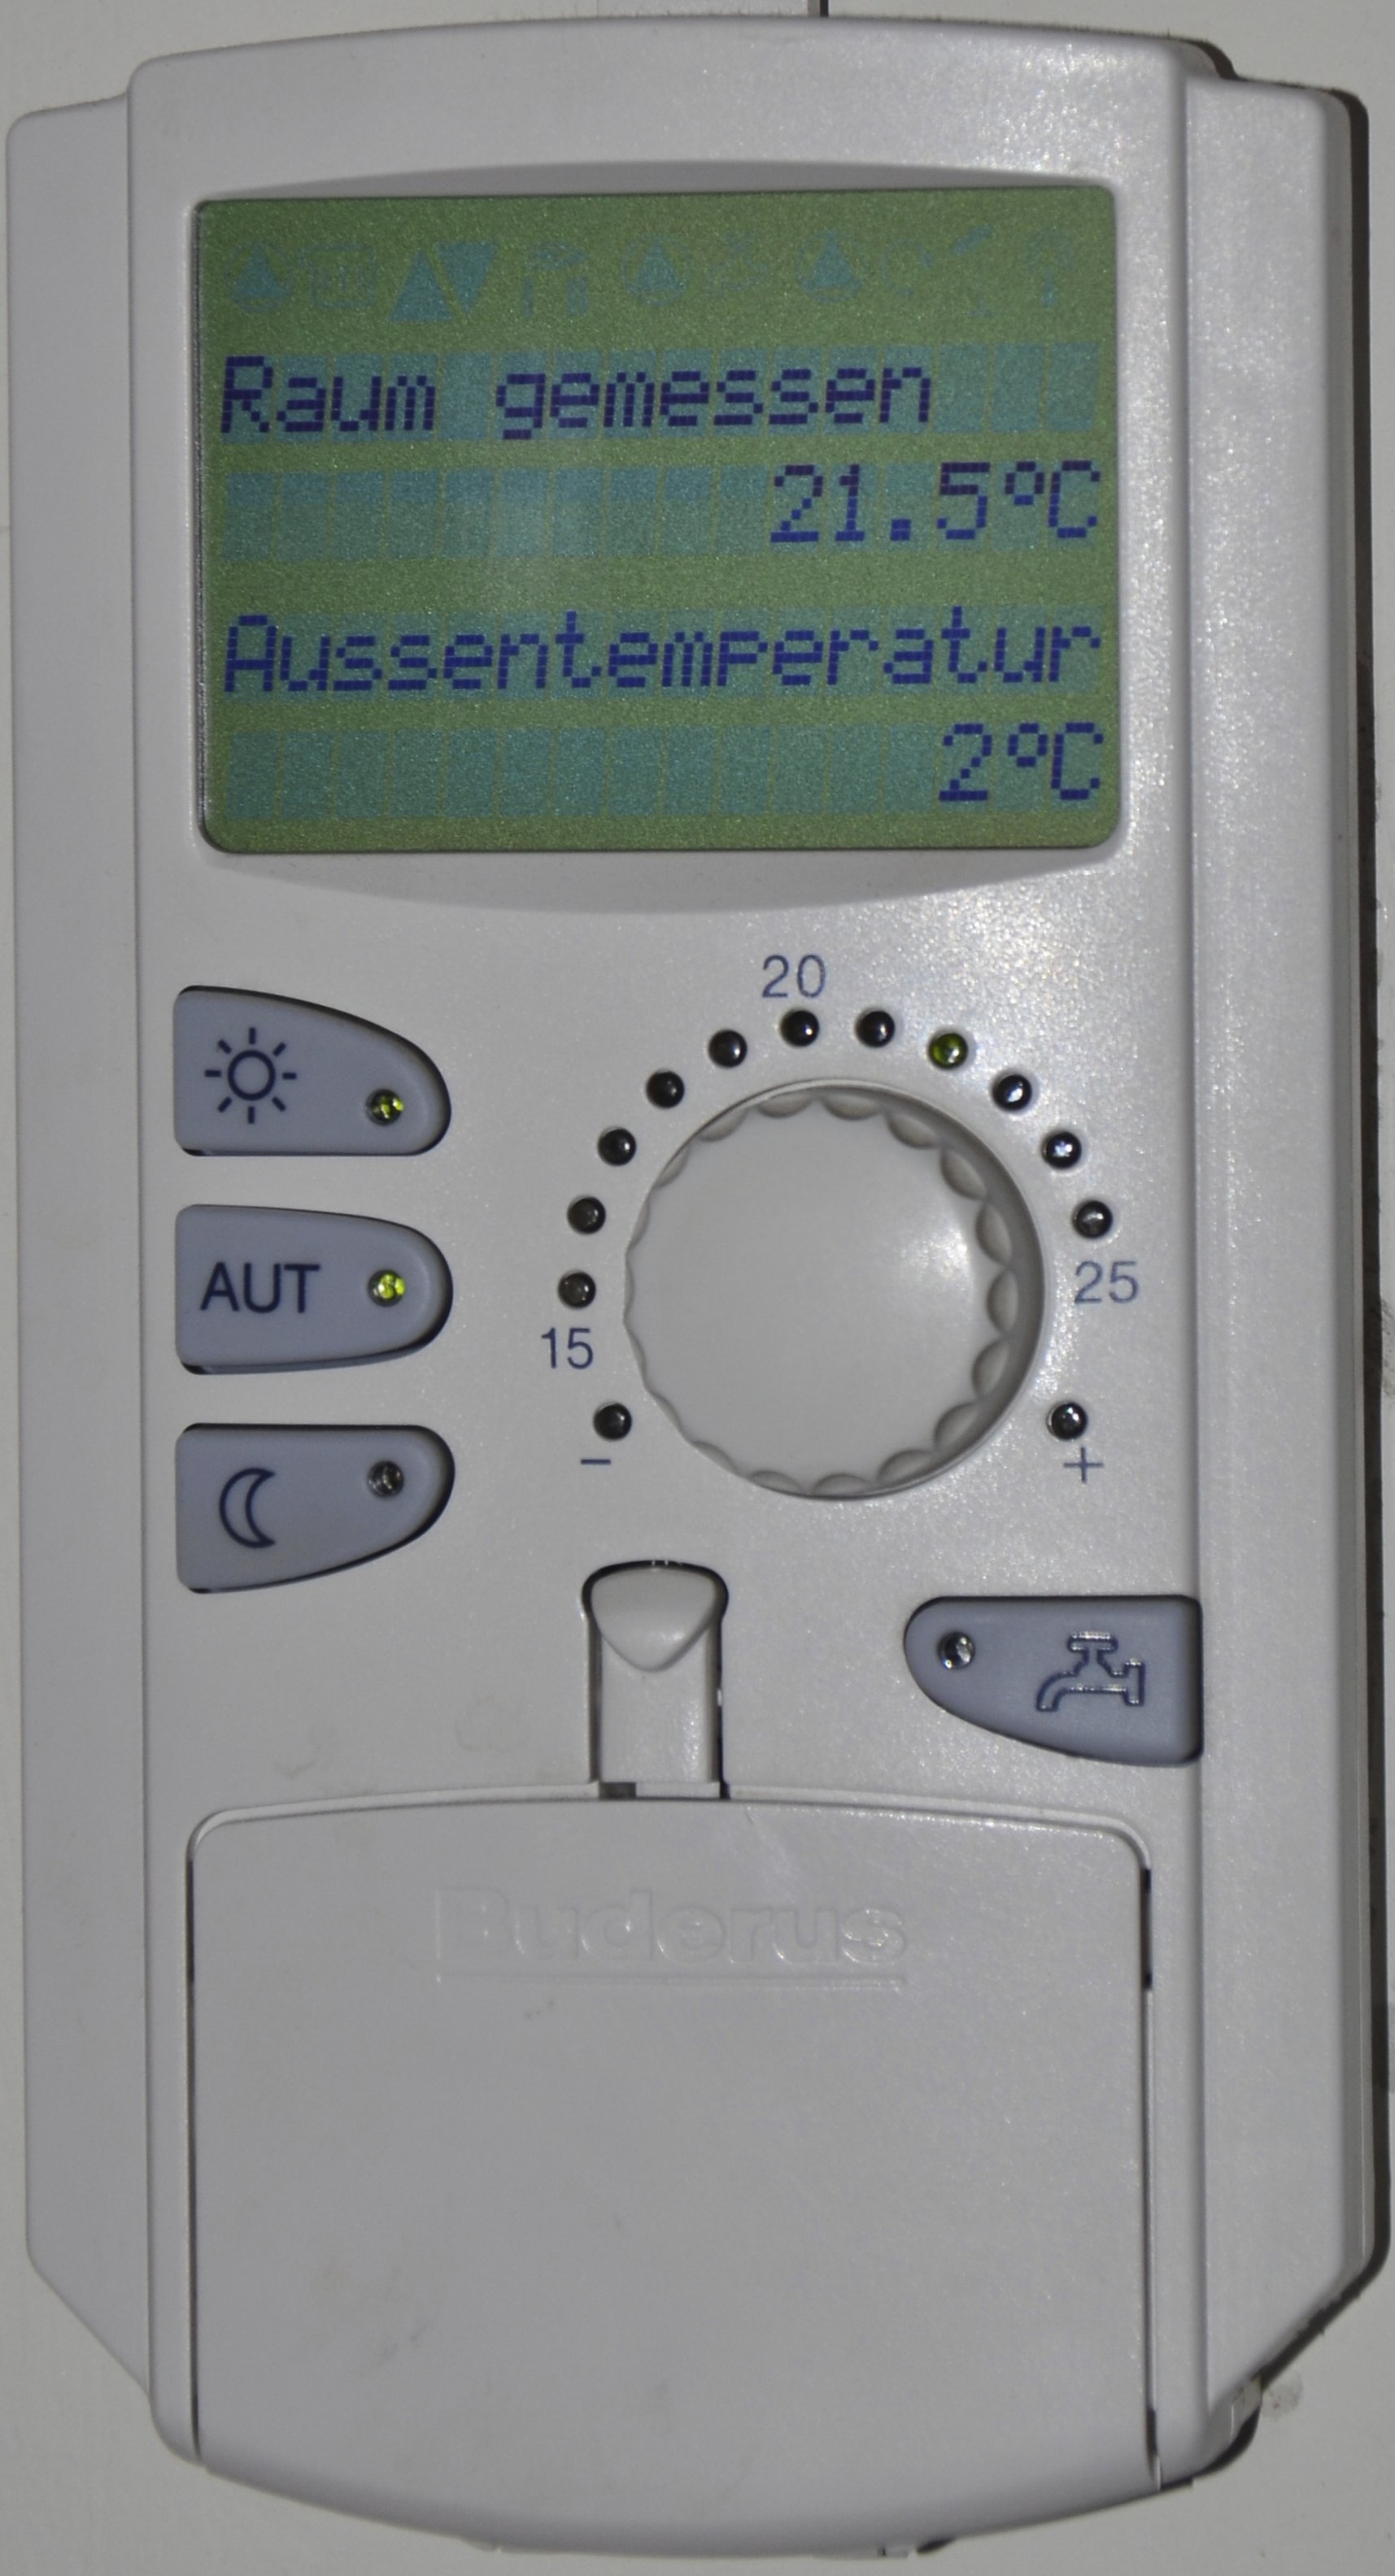
Remote Units (Room Sensors)
Type BFU (left), Type MEC2 (right)
Buderus controllers of that generation do have a proprietary «ECO-CAN Bus» to be externally controlled and/or monitored, however, it's not just a matter of plugging some simple (read cheap) interface between this bus and the Internet. The manufacturer offers a serial interface and PC application for several 100€ but nothing in the way of the newer web- or app-based solutions.
The good news is that the room sensors of the 4000 series are «smart», i.e. communicating digitally with the furnace-mounted controller over a two-wire bus. Which zone a remote unit is assigned to can be selected via a small coding switch inside the remote. The remotes are bus-powered.
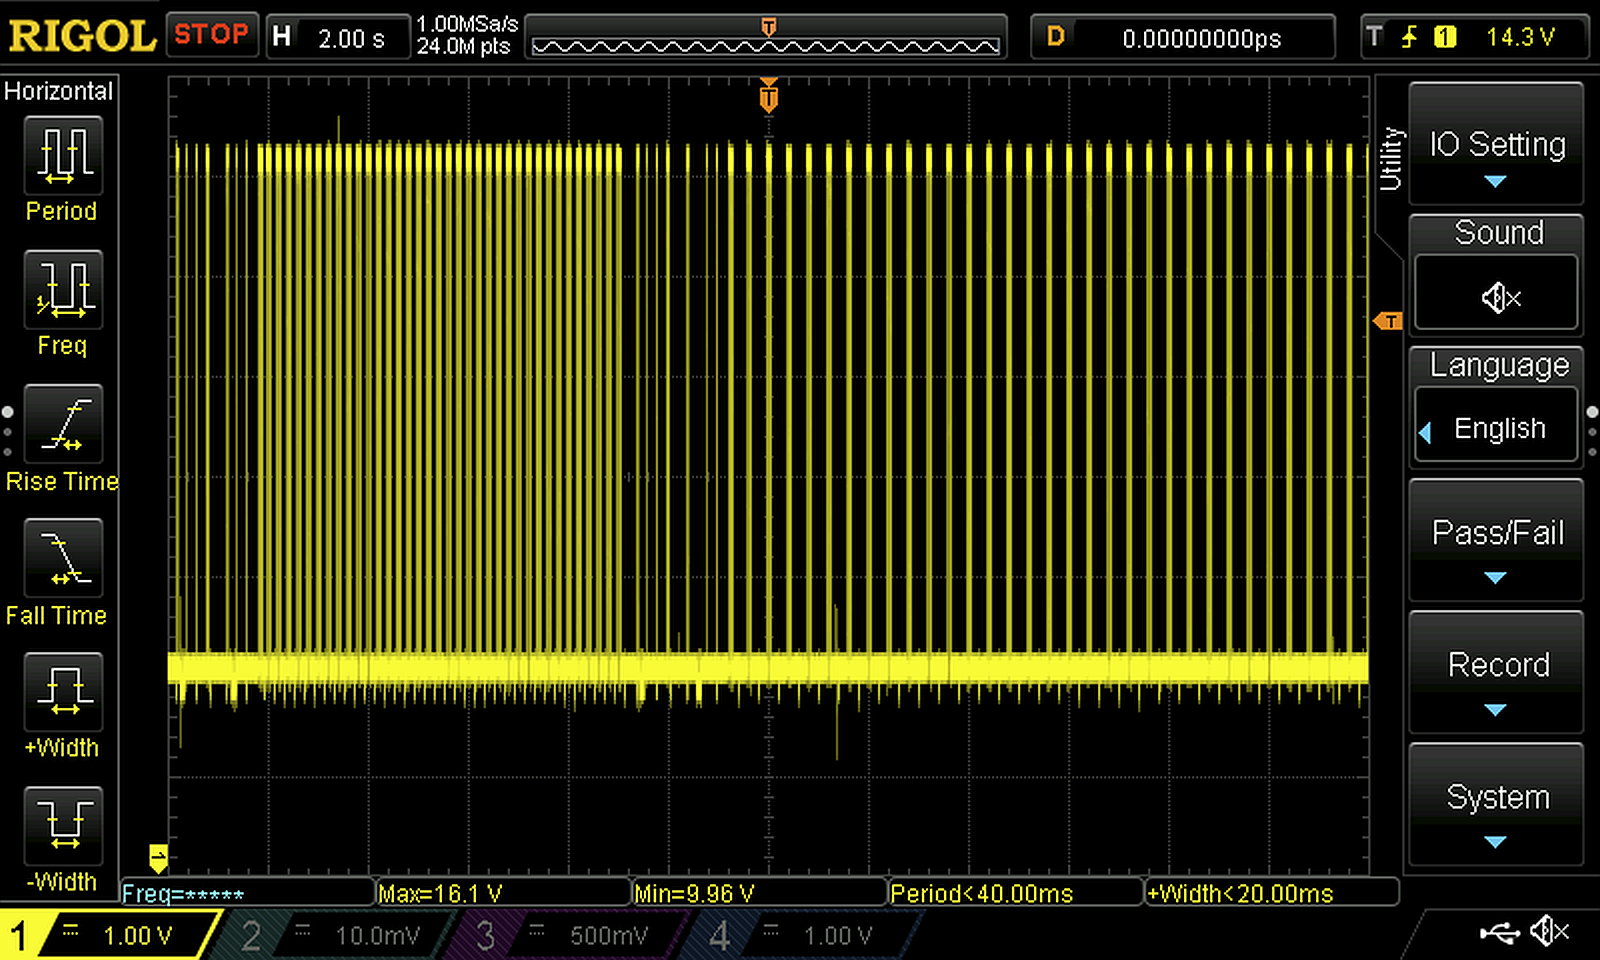
A little further analysis shows that all remots in the system are effectively connected in parallel to the same bus, even though there are multiple terminal pairs in the controller for them.The remote unit interface is relatively simple. It uses an asynchronous serial protocol with an idle state of +10 V and ana active state of +16 V so the devices receive power at all times.
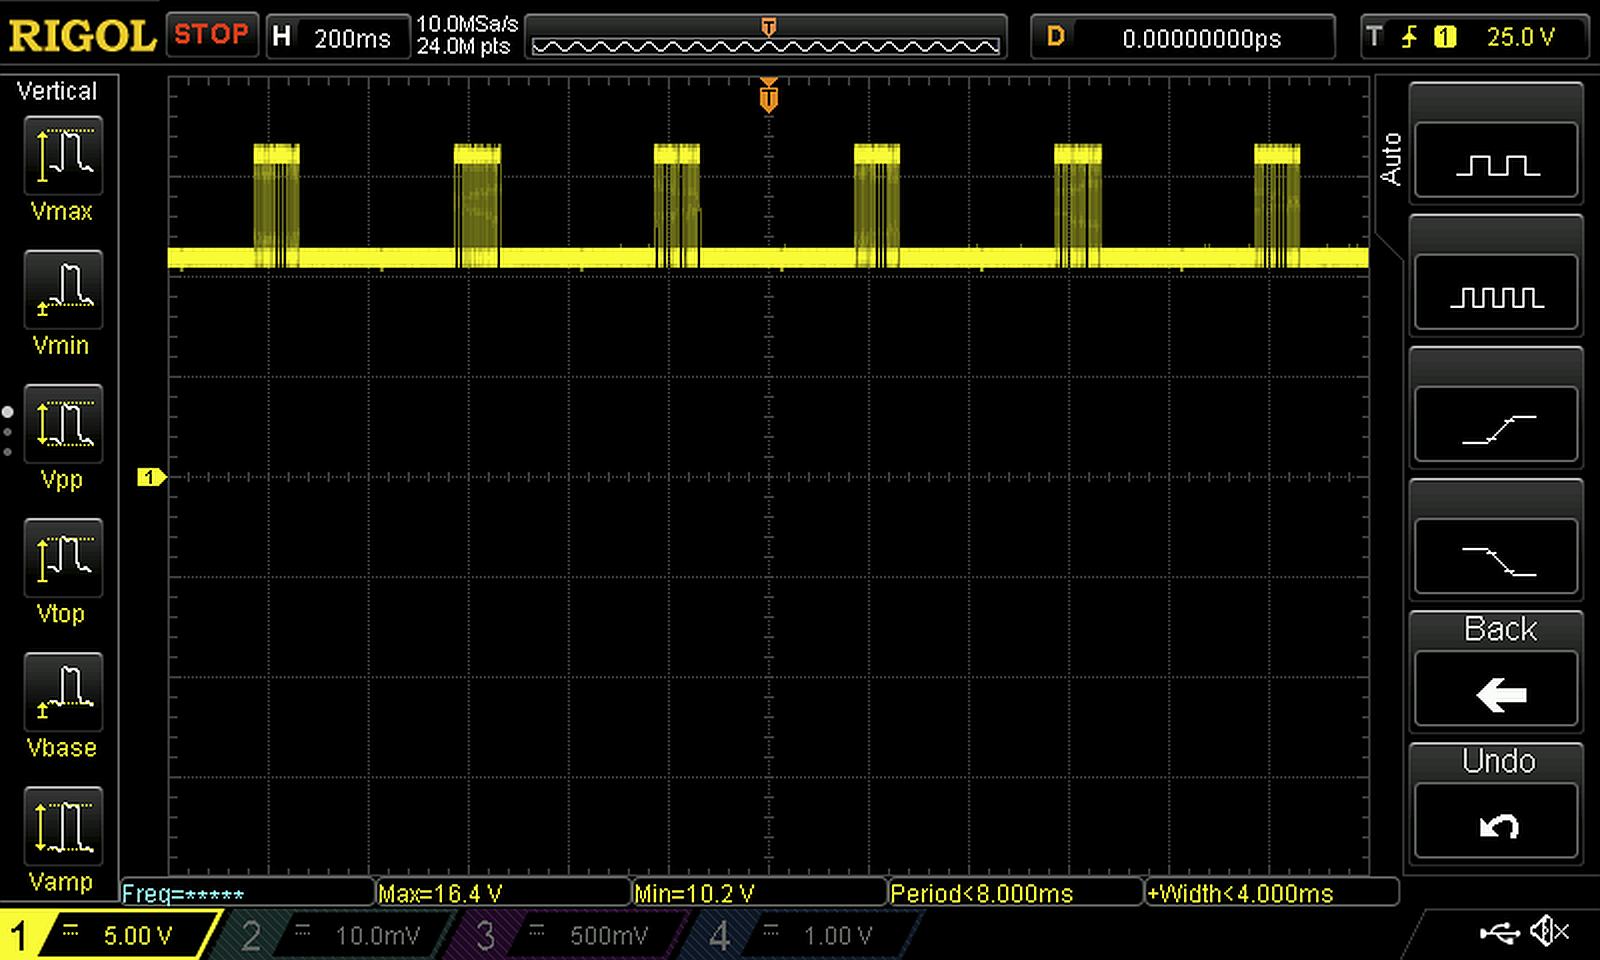
Serial Protocol (1). Idle level +10 V and active lavel +16 V can be seen.
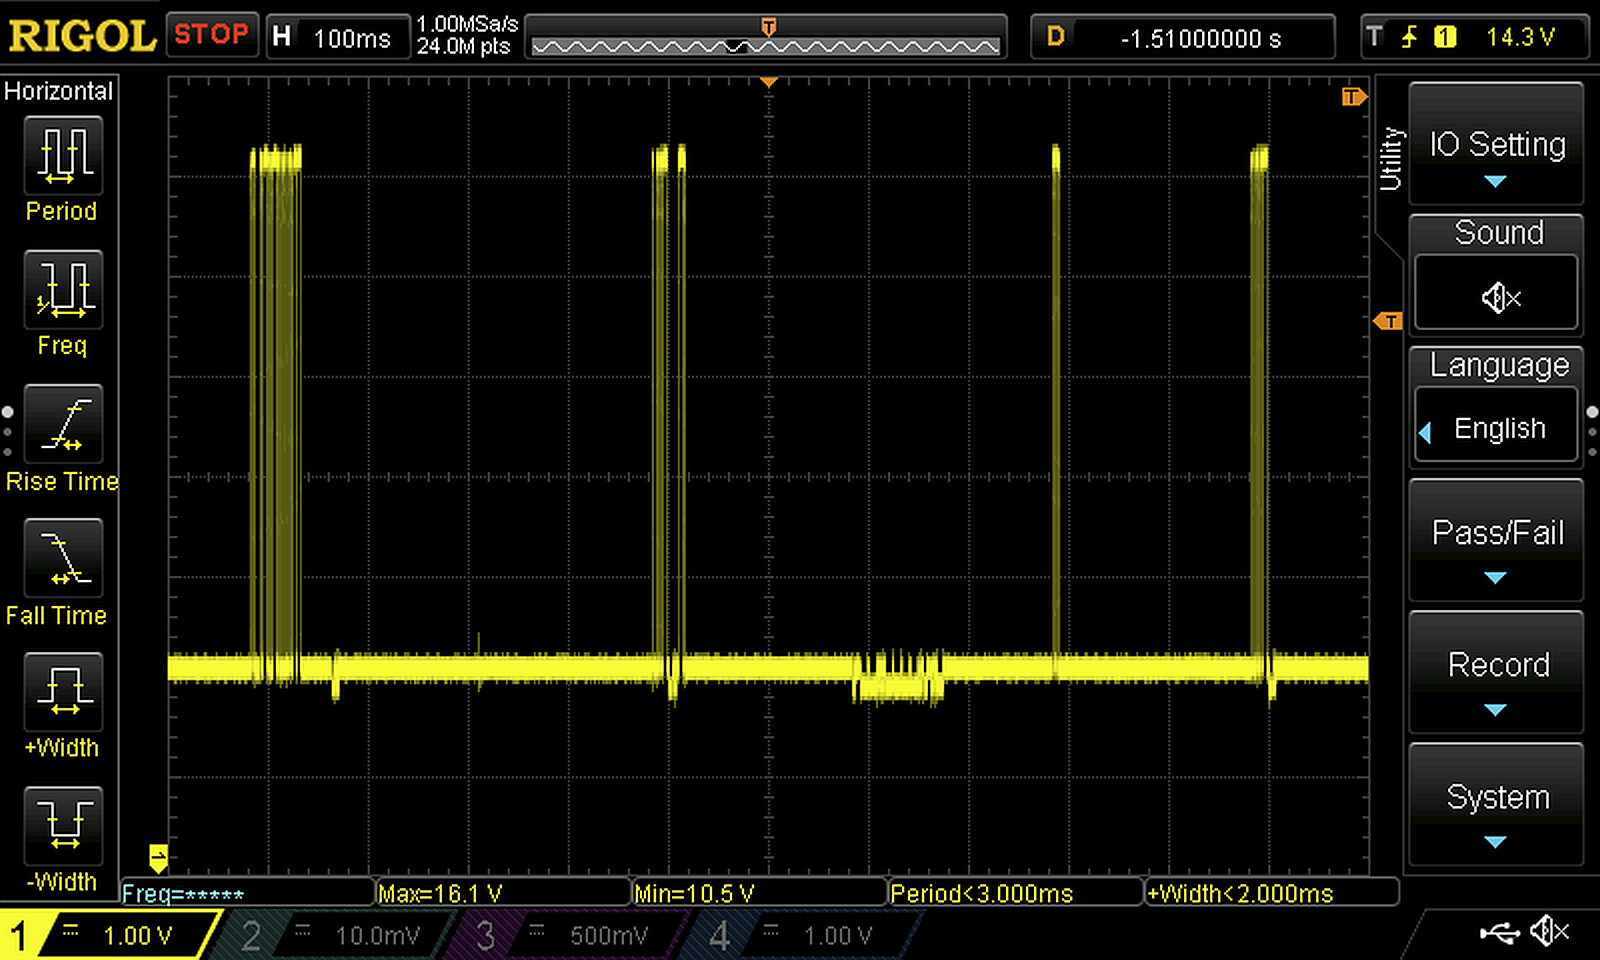
Serial Protocol (2). Remote unit responses to controller query.
Obviously, the room sensors' replies to the controller are current-based. This signal can be seen as voltage levels less than +10 V on the bus. However, due to the low voltage excursions this signal is not easy to monitor by looking at the bus voltage only.
The serial data format is simple: 1200 bit/s, 8 bit, 1 stop bit, no parity. Transmissions always occur in blocks of a few bytes, possibly with reply frames inbetween. Some of the replies contain data bytes, others are very short (presumably just an «ACK»).
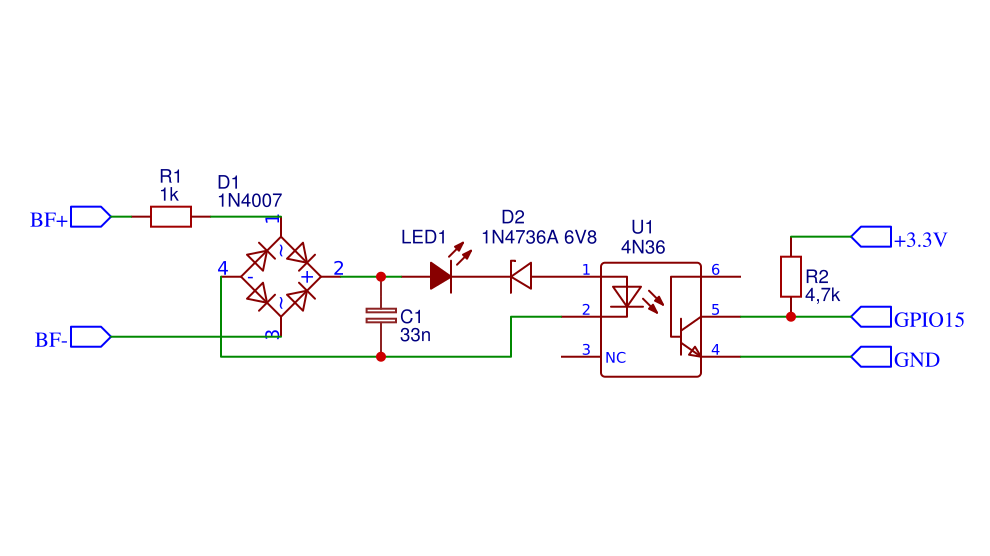
To record and analyze the transmissions, I built a simple inverting level shifter using a 12 V zener and an NPN transistor. A better circuit for production use would incorporate an optocoupler.

Raspberry Pi with level shifter PCB on top, sans case
To implement the interface, I used a Raspberry Pi that I had at hand (and it's also cheap and includes the required network interfaces), even though it is really overpowered for this task. This was before the Raspberry Pi Zero W was released, which is a better fit for this purpose.
Advantages of this solution include the galvanic separation of the heating system from the network, the ability to connect via Ehternet or WiFi as needed, and the simple programming using one of my favourite languages the other side of solder — the «Pathologically Eclectic Rubbish Lister».
This choice of language may surprise some but Perl ist quite usable for rather low-level work like tinkering with binary data through serial interfaces, and a large number of libraries are available for all sorts of purposes.
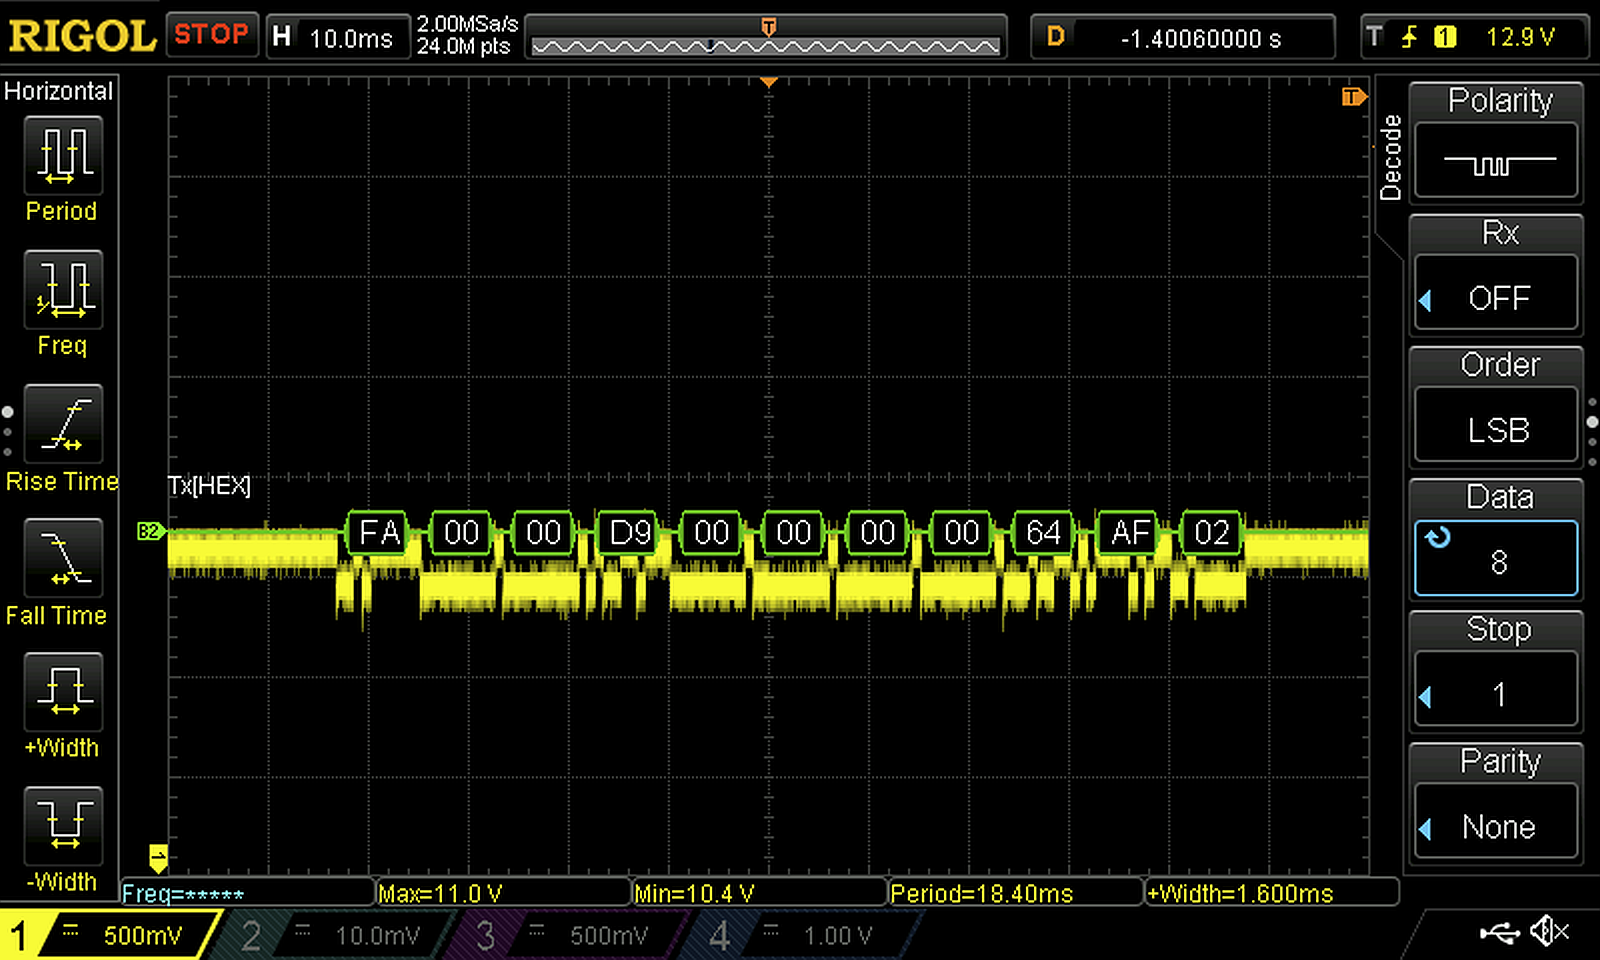
First, however, we need to decode the structure of the controller's transmissions. A typical data block as shown here contains 11 bytes:
80 00 04 02 2A 28 2C 2C 53 AF 82(hex). Watching a sequence of such data blocks, it is apparent that there are several successive blocks where the first byte is 80h, then 81h and other values, whereas the second byte contains values increasing from 00h in steps of six, i.e. 00h, 06h, 0Ch, 12h, etc.
With some experience one will quickly realize that the telegrams contain six data bytes, a checksum byte, and a fixed sequence (AFh 82h) at the end (a request for the remotes to transmit maybe?)
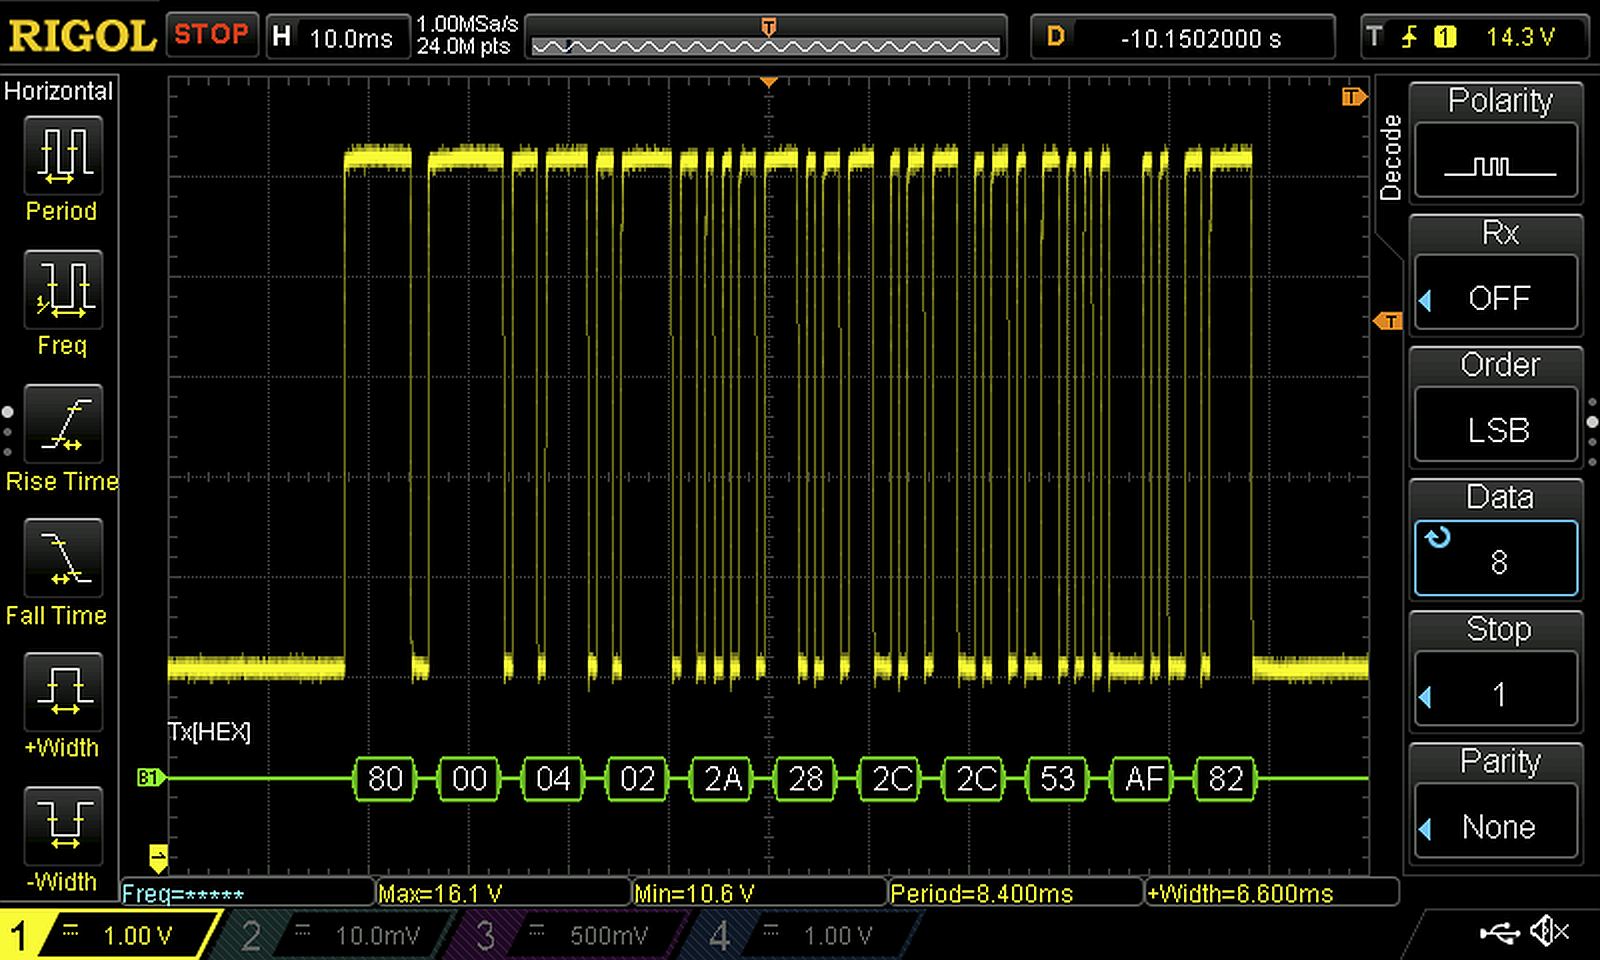
Serial Protocol (3). A typical frame in detail.
Data are transferred at 1200-8N1.
Obviously, parameter blocks with a leading block number (80h in this example) are transmitted in frames of six bytes each, with the second byte giving the starting offset.
Next, one would have to start guessing the meaning of the data bytes, e.g. by comparing the values shown on the MEC2 display in monitor mode with the bytes on the wire that are not documented. It's a good thing that programmers tend to be lazy though — the documentation of the serial interface mentioned earlier (Buderus file «Technische Information Monitordaten System 4000») nicely explains the telegram numbers and shows the same multiple-of-six byte structure, i.e. that interface does not translate the data at all! (What makes it so expensive then?)
The telegram shown above represents monitoring data for the first zone (80h). The first two data bytes (04h 02h) contain status bits, the next byte is the zone temperature setpoint (2Ah = 42°C), followed by the current zone temperature (28h = 38°C), etc.
The current verion of my Perl program can be downloaded here (messages to the user are in German, sorry). After adjusting a few configuration parameters it will run directly on an RPi as long as the required Perl modules are installed (use CPAN if needed).
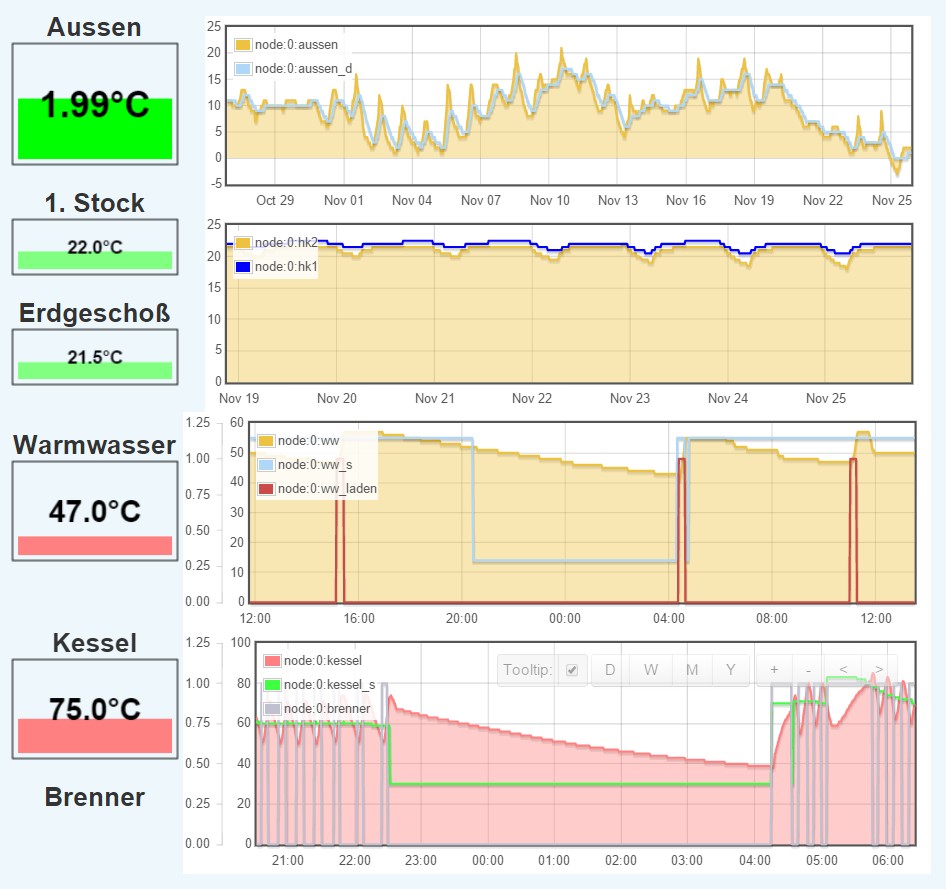
A sample dashboard from EmonCMS. The lower graphs show target and current temperatue along with the burner/pump status.
The program writes the data received from the bus text file /var/log/buderus, and in parallel sends updates to emoncms.org. The update key that needs to be configured in the program can be copied off the EmonCMS web interface after registration. (Note that while emoncms.org used to be free, they now charge a modest fee per feed and year.) In addition, you will have to specify email addresses and an SMTP server used to send alerts, e.g. in case of a burner failure.
One key advantage of EmonCMS is that it can also be installed on your own server, so it is easy to start with some experiments on emoncms.org and set up or own instance later. There is also an EmonCMS distribution for the RPi, or it could be installed on top of a standard Raspbian system.
EmonCMS stores the measured data and can display it in nice graphs. The logical data flow in EmonCMS is Input → Feed → Graph → Dashboard. «Inputs» are created automatically based on the JSON data sent by the monitor program. For any parameter to be tracked over time, one creates a feed in the EmonCMS web interface. The feed setup determines how often the values are stored. For most parameters it is best to select the realtime/phptimeseries feed type.
Feeds can then be used as the basis of graphs — the most versatile is the multigraph — and graphs can be combined into «dashboards» like the one shown here.
My program alternatively supports sending the data to an MQTT broker, allowing other home-grown monitoring solutions to be configured using Open Source components, e.g. using hte ubiquitous Mosquitto as the broker, InfluxDB to store time series data, and Grafana for visualisation.I warmly welcome feedback and exchange of ideas on this project (→ projekte@holzleitner.com) — but do please understand that this is not a product and I am unable to offer support.
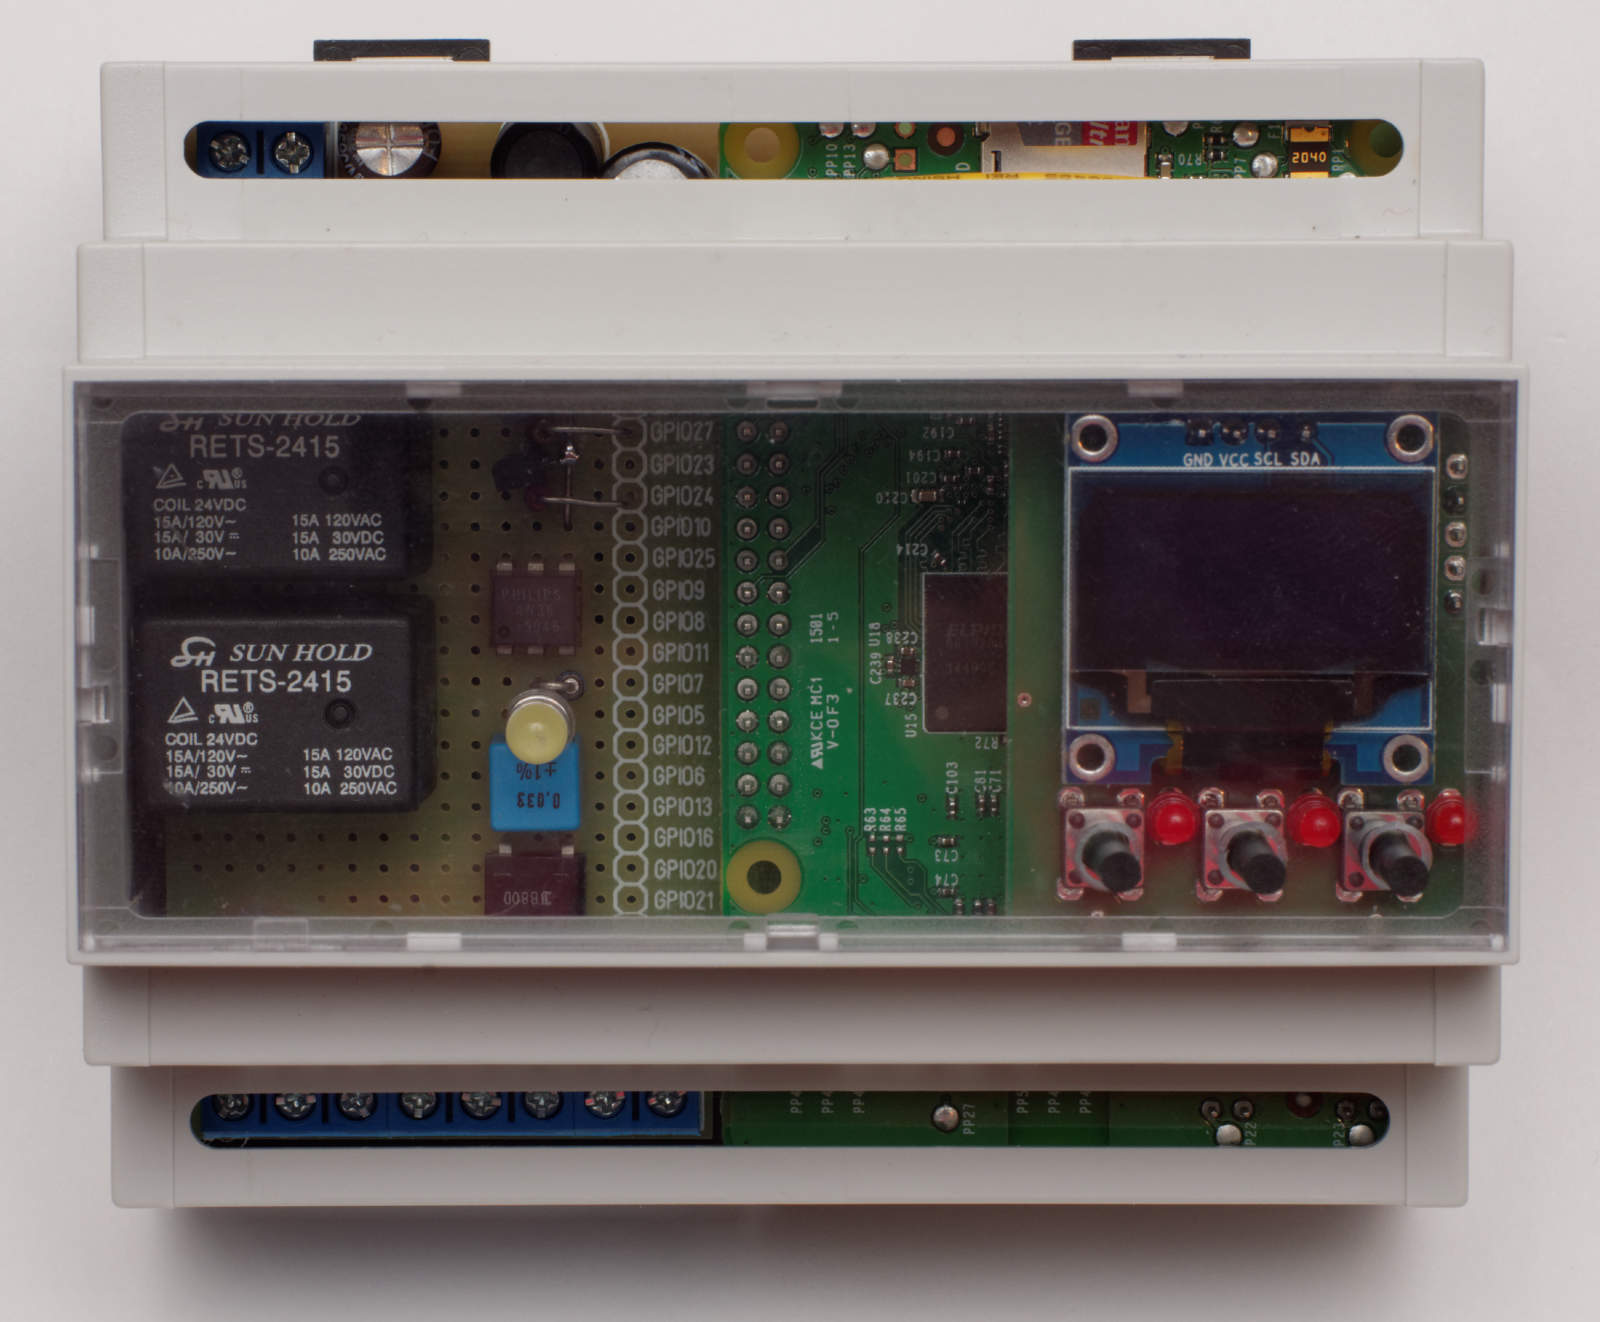
Second version of the monitoring hardware in a DIN rail case, with optoisolated level shifter and two extra relay outputs
I also built a second version of the monitoring hardware fitting the RPi into a «RasPiBox Open+» case adding an optoisolated level shifter and two independently controlled relays for other control tasks.
In my installation, the same Raspberry Pi additionally monitors a RESOL solar-thermal controller via its USB interface.
My cold storage room controller also logs data to EmonCMS.

Internal view of monitor hardware Mk.2