The Secret Life of Diodes
– or –
Honour the Picoamp!
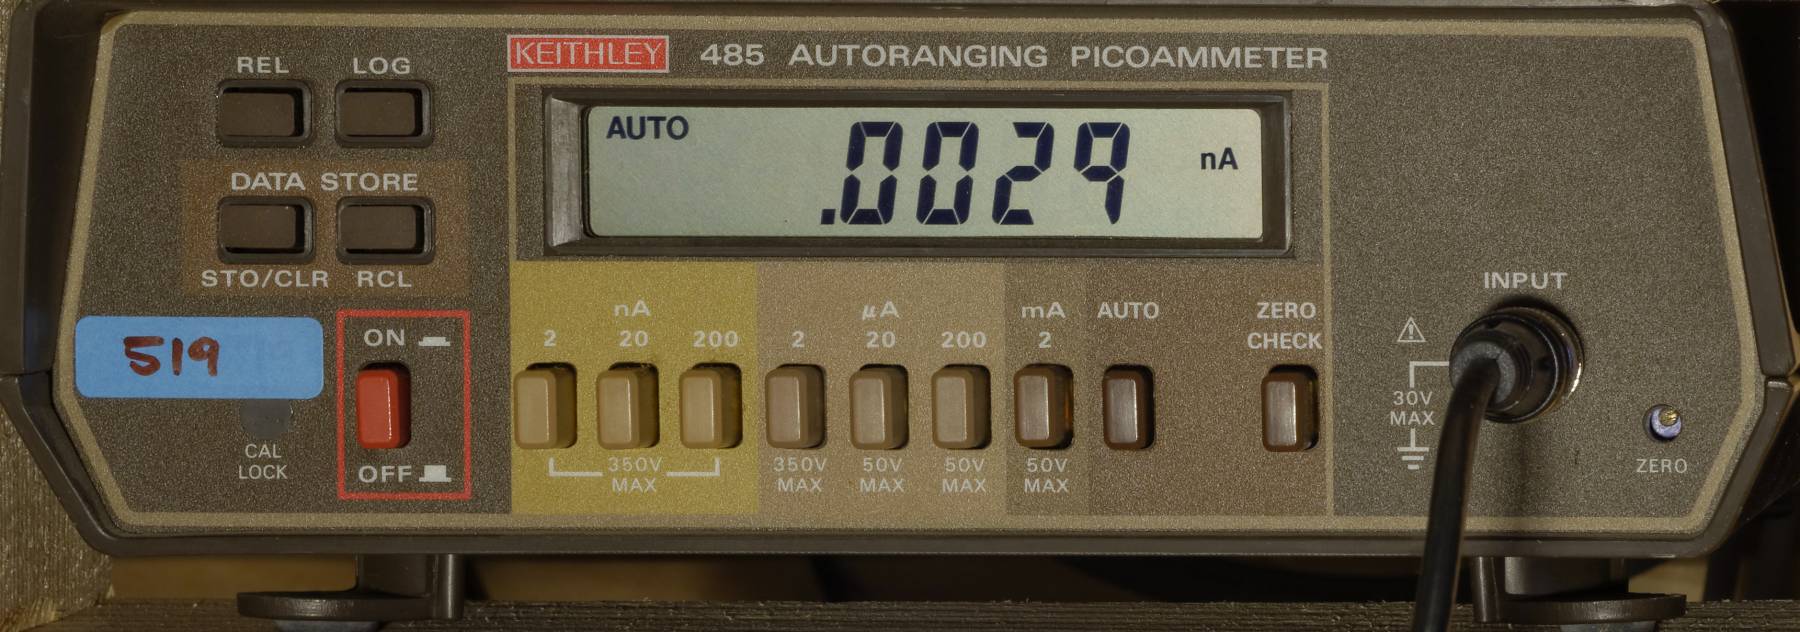
Keithley 485 Picoamperemeter
(click images to enlarge)
Once upon a time, a little Keithley 485 Picoamperemeter was strolling aimlessly across the bay when –CLICK!– it fell into a hole and came out in a new lab. Why, we're not measuring picoamps every day – hang on, PICO? It only says 2 NANOamperes on the leftmost button ...?!?
Well, as the 485 has 4½ digits = 19999 counts resolution, the rightmost digit displays 100 fA (0.1 pA) units. But how much is left of that when you take off the marketing fuzz?
So let's put the beast to some real use. Teraohm resistors exist but are rather hard to come by, however, since forward current through a diode follows the exponential equation I = I0 * (e U / UT -1), we get really low currents at 100 mV-range voltages.
So we wire up a bus-controlled power supply to feed a red LED through a current limiting resistor and write a little program to plot I = f(U). The diode is held in the air by the alligator clips so as not to introduce creepage paths, and is shielded from ambient light. The program wisely averages several readings for low currents and since we're plotting on a log scale, it discards any samples where the average turns out negative.
The result is some sort of exponential function after all (see picture), but the current won't fall below some 10 nA ever ... so much for the gung-ho measurement style.
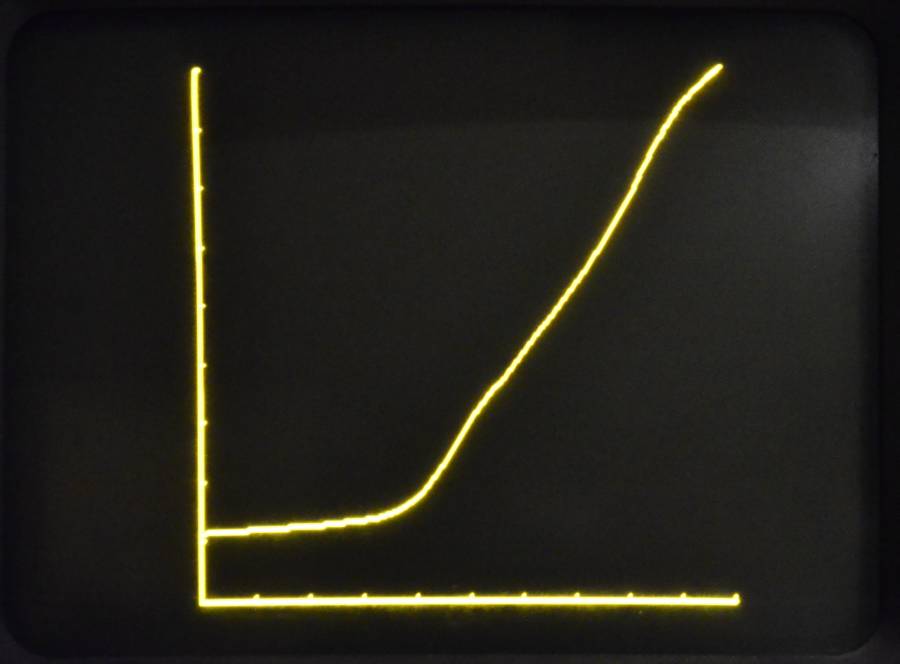
Red LED If vs. Uf characteristics.
X = 0 — 2 V lin., Y = 10-12 — 10-3A log.
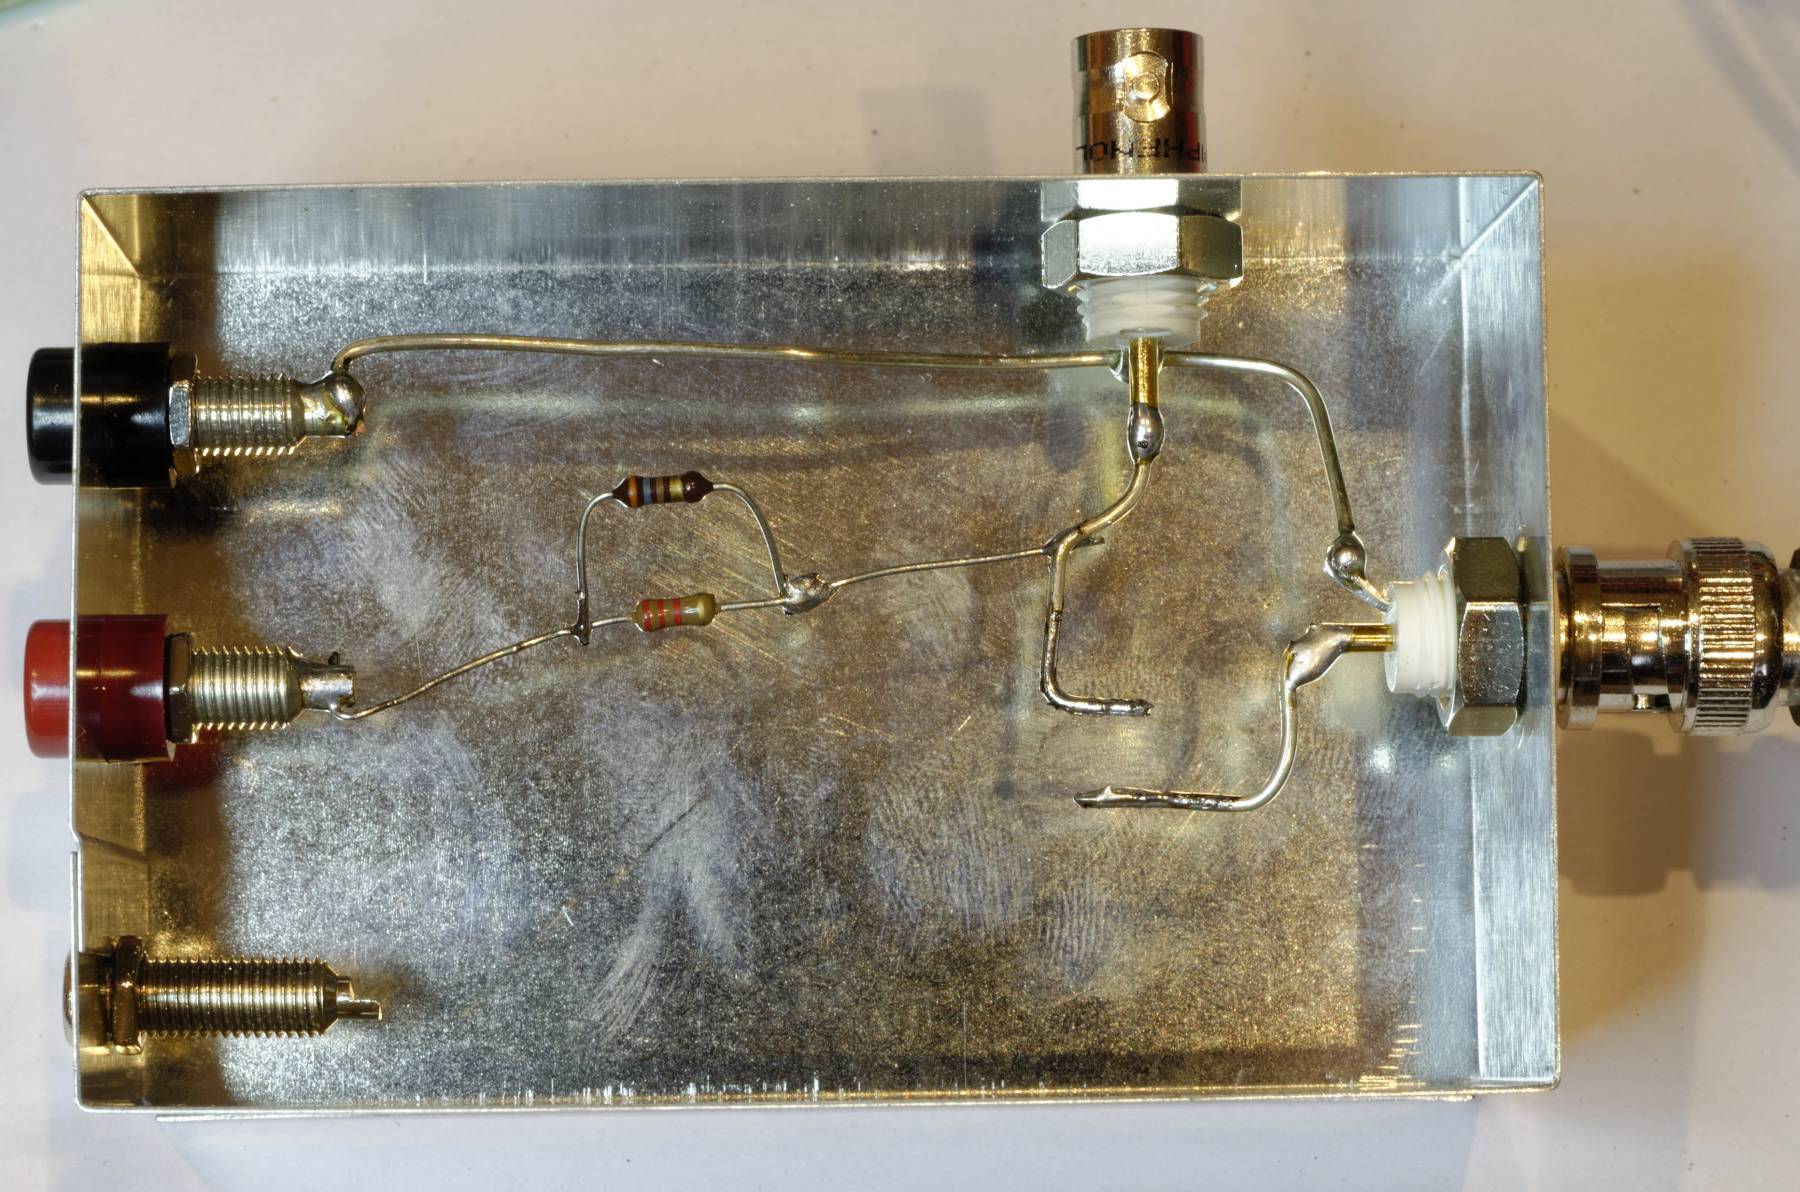
Test fixture
OK, so let's build a proper test fixture, shall we? Using a small metal RF shielding box, teflon insulator BNC sockets and coax cables where it matters, keeping shield separate from supply etc.
The program gets a few extra smarts too — average more samples at low currents, subtract system offset as measured with the supply turned off, and draw the result on a good old pen plotter (BTW, the computer here is a Hewlett-Packard model 86, a real 625 kHz rocket of early-1980s vintage, programmed in BASIC. And the pen plotter does drag real pens across real paper, of course. Retro rocks!)
Lo and behold, the whole effort was worth something — now we do get clean curves down to some 0.5 pA. To put this number into perspective: That's only about 3 million electrons per second that decided to travel in the same direction.
What was measured
- Resistor, 1 GΩ
- OA81 Germanium diode (pretty old)
- BAT41 HF Schottky Diode
- 1N4006 universal Si diode
- BU208 HV power transistor (B-E)
- BC337 generic low-power Si transistor (B-E)
Discussion
- BF256B J-FET (G-S)
- CNY17 opto coupler (LED)
- infrared LED
- red LED
- blue LED (1)
- white LED
- blue LED (2)
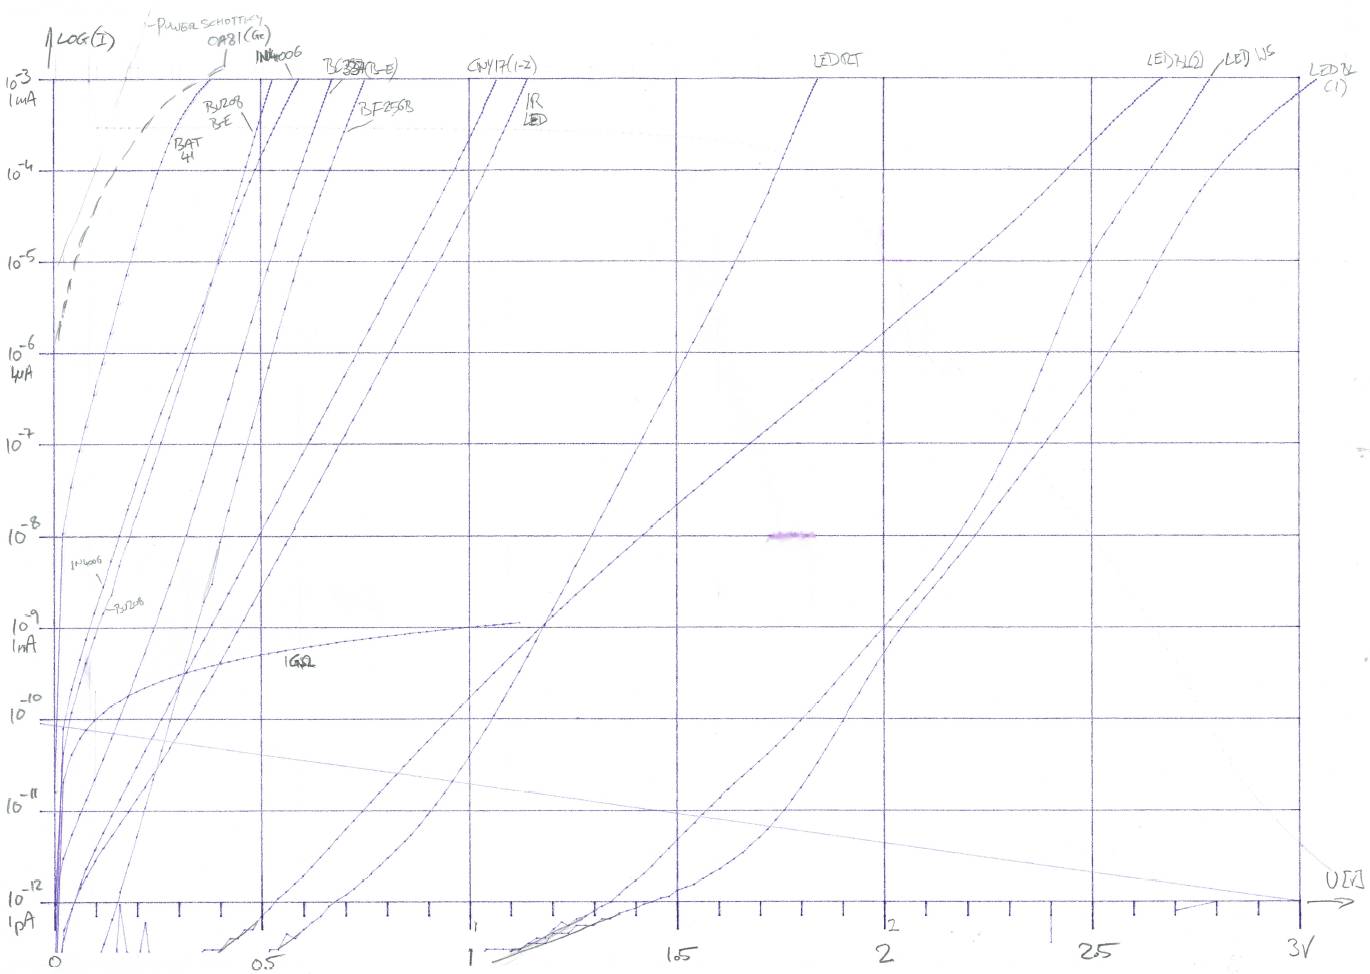
U(I) characteristics (→ high res PDF)
The diagrams are drawn in a semi-log coordinate system with voltage (linear) on the X axis, 0 – 3 volts, and current (logarithmic) on the Y axis, 10-12A (1 pA) – 10-3A (1 mA), i.e. 6 decades in all.
An ideal exponential characteristic would plot as a straight line in this diagram. A constant resistance will show up as a logarithmic curve, for example, the 1 GΩ resistor thrown in for fun and illustration.
The first thing we note is that the OA81 and (less so) the BAT41 appear to have some relevant amounts of series resistance.
The "nicest" curves, i.e. those deviating the least from the ideal, ar those of the BC337 Si NPN transistor, the BF245 Si JFET, the infrared diode, the opto coupler and the second of the two blue LEDs.
We may also infer that the LED in the opto coupler is of the infrared type as well, and that the blue LED (1) is a close relative of the white LED, but that the other blue LED is quite a different animal and probably uses a different semiconductor material.
The World is Non Linear. Diodes Doubly So.
Conventional wisdom has it that your typical silicon diode will just begin conducting at 0.4 V and only around 0.6 V – 0.7 V will the forward current rise sharply.
Now this is of course the limited view that results from looking at a diode like the 1N4006 through a meter fixed in the milliamp range. But as we found out ...
All Silicon Diodes Are Not Created Equal!
Our example 1N4006 "draws" around 0.15 mA at 0.5 V forward voltage — a diode-connected BF256 JFET, in comparison, only some 0.2 μA!
The Ugly Overvoltage Protection Circuit
So you've been using two anti-parallel diodes to protect an input against excess voltage? Let's see how well that works. Consider our friend the 1N4006. By your old rule of thumb you'd expect nothing much to happen below an input voltage of 0.6 V, right? Surprise! Let's say our source has an impedance of 10 kΩ, not all that much if you've ever dealt with a glass electrode to measure acidity (PH). Let's say our input signal is well below the 0.6 V, maybe 0.4 V. The diode current will be 10 μA. This current will cause a voltage drop of 100 mV across the source impedance! That's a 25% error (or nasty harmonics/intermodulation for you audio and RF folks).
Build a Better Protector ...
... from LEDs! A simple red LED at 1 V forward voltage has a forward current of less than
0.1 nA! You will have to shield LEDs from light. In the series above, the infrared LED would still
detect light even though the metal box was closed, it had to be put in a black bag to shield it from ambient light.
If you are lazy, you can buy ready-made light-proofed LEDs off the shelf (if you doubt me, look under
opto couplers in your favourite catalog). 10 nA at 1 V is still orders of magnitude
better than ordinary Si diodes. And you get an input overload indicator for free (coupler output).
LED capacitance too high for your application? An extra RF Schottky
diode will cure that.
Different Shades of Blue ...
The beautiful 7-decade LED based logarithmic amplifier published by Acharya und Aggarwal will work just great with our blue LED (2) but if you were to use blue LED (1) you'd get errors of more than a decade! Caveat lucifer :-)
Some more things to do in our copious spare time ...
- Add unit labels to the plot program, use different colours, ... (what's wrong with a pencil?)
- curve fitting – calculate I0, Rs, ...
- start over and include temperature as a variable
- pulsed measurements at currents above 0.1 mA to avoid self-heating errors
- extend curves to at least 1 A for those diodes that can take it (must use pulsed meaurements)
- plot some more diode types: Selenium, tunnel diode, GaAs-JFet, high power LED, Ge power transistor ...
- plot zoomed version 0 – 0.5 V for low-power and Schottky diodes
- compare these curves to those from the appendix in the great late Bob Pease's Troubleshooting Analog Circuits